After the Crash: How Private Markets Recovered from the Last Recession
On February 19th, 2020 the US stock market hit an all-time high[1]. Within three weeks as the COVID-19 pandemic blew onto US shores, it had dropped over 20% falling into bear market territory. Although prices have since bounced, the full impact on the economy and capital markets has yet to be felt. Demand for goods and services across many industries has dropped precipitously, leaving many companies facing dramatically decreased revenues and potential insolvency.
At the same time, investors are reassessing their portfolios in light of the increased risk and uncertainty, leading many to pull back from the market altogether or insist on lower valuations. With the lockdown still in place in many countries, it is not possible to know exactly how this will play out, although many economists are predicting this recession to be as deep as the Global Financial Crisis (“GFC”), With this in mind, Texture Capital, went back and analyzed how capital was allocated to private markets emerging from the last recession, so that we can better inform our expectations as we rebuild following the COVID-19 recession.
Data Analysis
In thinking about how private markets might recover from the current crisis, Texture Capital analyzed how the private securities market recovered from the last crisis in 2008. To do this we crunched through about 400,000 Form D filings submitted to the SEC’s EDGAR database[2] from 2009 - 2019. Issuers raising capital under Reg D (an exemption under the Securities Act of ‘33 - see previous Texture blog here) will file Form D as notification to the SEC. Electronic submission of Form D was only rolled out in 2008, so it is not possible to look at levels of private investment activity prior to that, but we can observe how the market recovered and grew from 2009 to 2019. For this analysis we stripped out pooled investment funds and insurance products, which also sell investment products under the Reg D exemption (representing about half of the total number of filings) and focused on operating companies - the engine of the US economy.
Fundraising Levels
The chart below shows the amount raised via exempt Reg D for operating companies from 2009 - 2019. As we can see the total amount raised more than doubled over the cycle from $90bn to $180bn per year, with Technology, Real Estate, Banking & Finance, Health Care and Energy being the major sectors. In addition, the Form D also allows for issuers to enter their industry as “Other” which represents 21% of all filings by operating companies.

Source: Texture Capital
To frame this analysis, let’s define 2009 as the recovery year, 2010 - 2012 as the early part of the cycle, 2013 - 2016 as mid-cycle and 2017 - 2019 as late cycle. So as we transpose the historical onto the current environment, we can think of 2020-21 as the recovery year. We see that coming out of the last recession, private investment was down 23% in the recovery year compared to the early stage of the business cycle and as much as 50% lower compared to the late stage of the cycle. A similar effect can be seen by looking at deal count.
Average Raised and Number of deals through each stage of the recovery:

Source: Texture Capital
Industry Breakdown
Extending this analysis of funding through the cycle, we can see how industries recovered from the Great Recession in different ways. The Global Financial Crisis was precipitated by an over-extension of credit from the banking sector to the real-estate sector in the form of subprime loans. But the banking, real estate, and other sectors all behaved very differently coming out of the crisis.
Banking and financial services companies received about the same level of investment in the recovery year as they did in the early and middle stages of the business cycle. This may seem surprising, but if we recall the immediate aftermath of the Lehman collapse, financial services companies were desperately trying to recapitalize and were issuing equity and debt to do so. Hence the relatively constant level of private securities issuance. This time round we should see similarly robust investment levels in the banking and finance sector… not because entities are being recapitalized, but because the nature of the current stimulus programs are about pumping money into the economy and financial institutions are the plumbing that enables this.

Source: Texture Capital
The energy sector suffered badly in 2009 with private investment levels 50% lower than typical during the cycle. While the 2008 crisis was not energy related, the energy sector can represent a proxy for the global economy. As such, when the world entered recession, consumption and output dropped; reducing demand for energy. Things may well play out in a similar way this time round, if not worse. On top of a global economic downturn, Russia and OPEC have been feuding over market share, driving oil prices down to historic lows making energy extraction unprofitable for many companies, particularly in the US which is more dependent on expensive shale oil production[3]. These twin headwinds make it likely that we will see private investment in the energy sector cut by half over the next year. One counterargument is that some oil companies may need to be recapitalized which could in fact lead to an increase in private investment similar to what we observed with the banking industry after 2008.
The manufacturing industry, although smaller at only 3% of total private investment over the cycle, fared much better coming out of the GFC. In fact, the recovery year saw investment at double the average for the business cycle. This could be because efforts to restart the economy were focused on ‘shovel ready’ projects and included bailouts of the automobile and related industries, which in turn stimulated private investment. As the nature of this crisis is different, it is unlikely we will see the same recovery year boost to manufacturing.
The technology sector received a similar level of investment in the recovery year as in the early stage of the business cycle but doubled those levels from 2013 to 2019. As the technology sector represents innovation in the US economy, there will always be investors looking for the next Uber or Google. Investment will fall but will more likely be manifested in lower valuations rather than a retreat of capital. Indeed, in large part the high levels of investment we observe in the mid and late stages of the cycle following the GFC, can be attributed to overvaluation of high-flying unicorns.
In the healthcare sector, private investment in 2009, was similar as the years 2010 to 2012, but then we saw significant growth in the middle and late stages of the business cycle. However, the current pandemic is a healthcare crisis, so the most likely expectation is that we will see an increase in private investment in healthcare companies, perhaps as much as 50% higher than late cycle levels, as we saw with manufacturing after the Great Recession. This would translate into $30bn coming into US private markets in the first year of recovery.
The real estate sector was at the epicenter of the GFC, and took a massive hit in terms of new private investment, bringing in just $5bn via new Reg D offerings in 2009 compared to over $30bn per year since 2017. The SEC’s Form D allows for issuers to provide more granular information on the types of real estate activities they conduct. This is explored in more detail below.
Real Estate
The real estate industry is categorized into five subcategories: Residential, Commercial, Construction, REITS and ‘Other’. The latter category, somewhat of a catch-all, represents about a third of all real estate private investments, as reported via Form D.
The most striking observation, other than the anemic 2009 investments, is that there was so little investment activity in residential real estate projects for up to four years following the GFC. This reflects the overhang in the residential housing market stemming from the loosening of credit to subprime borrowers.
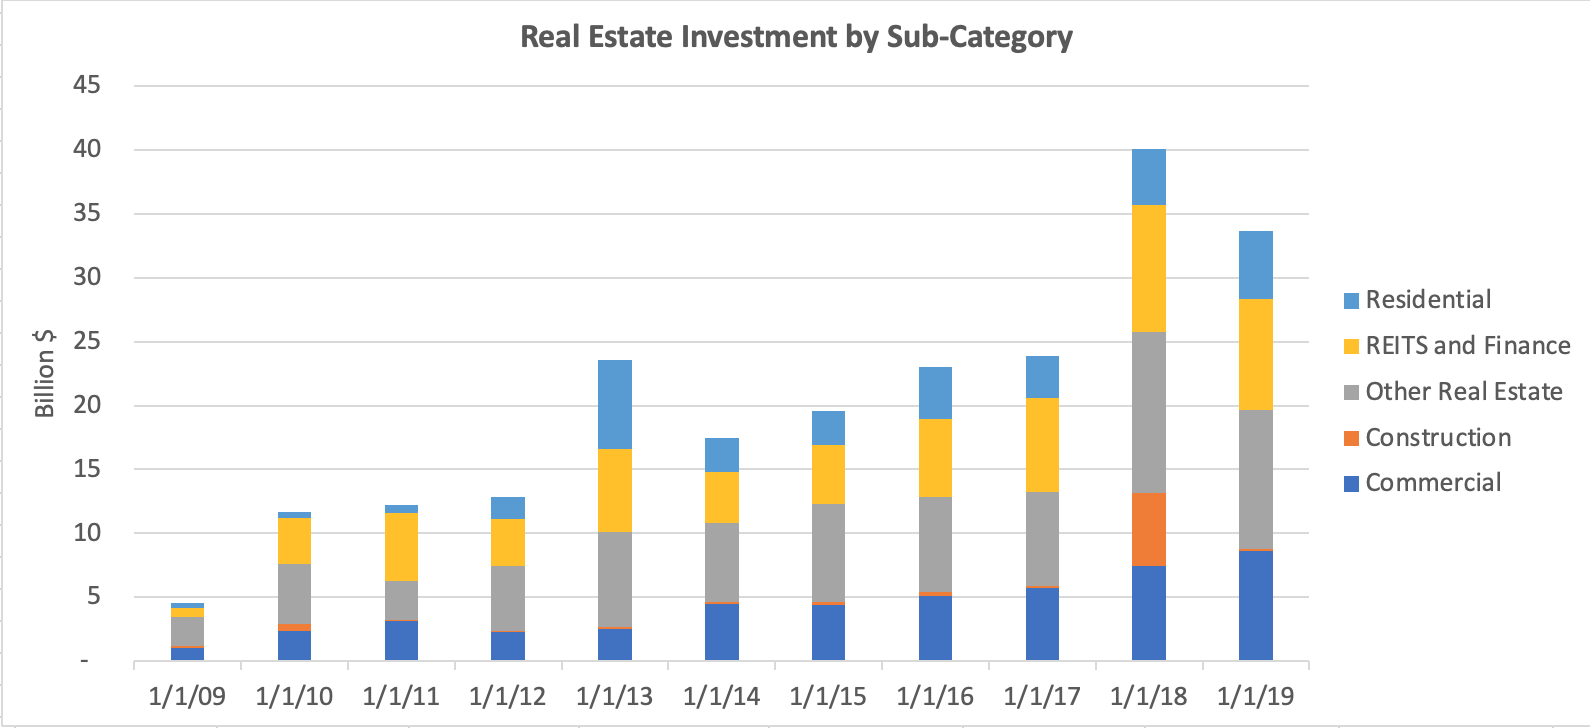
Source: Texture Capital
While we don’t expect real estate to be impacted in the same way or to the same degree this time round, it is likely that the sector as a whole will take another hit. Commercial real estate, including shops, offices, restaurants, and hotels will likely feel the biggest impact as social distancing means people work from home more, consume less, and reduce travel. If the past is anything to go by, it could take a year or more to clear the supply overhang.
Conclusion
As the saying goes, history does not repeat itself, but it often rhymes. Indeed, the current pandemic is like nothing the world has experienced in a century, but we have experienced market crashes and deep recessions before, and we can observe how investors react to these events. Through analyzing the private markets, we can gain a different perspective than looking at public markets alone. Investors in private markets can have a different perspective. For a start they are generally wealthier and considered more sophisticated. Many of the major players are high net worth investors, family offices, foundations and pension plans with a different investment philosophy, risk considerations and time horizon.
In looking at how private markets recovered from the Global Financial Crisis, we see that capital shifted away from affected industries quickly and sharply. Looking forward, issuers in private markets should brace themselves for a rapid realignment of private capital, and an overall reduction of 25% or more, with the number of deals dropping by a similar amount. Companies in affected industries like commercial real estate, should anticipate a drop of more like 50% in the availability of private capital. Energy will also likely be heavily affected and experience a similar drawback.
Healthcare is likely to be the exception and see an increase in investment. Just as manufacturing saw high levels of investment in the last recovery to help pull the country out of recession, investors will turn to health care solutions to get the country back to work.
As the US economy emerges from this crisis, Texture Capital will continue to analyze trends in private investment. Please sign up at https://texture.capital/contact to receive updates.
DISCLAIMER
The views expressed in this material are the views of the author and are subject to change based on market and other conditions. Statements are based on current assumptions, estimates and reflect subjective judgments and assumptions. There can be no assurance that the projections will transpire as noted or that the estimates are accurate.
All information has been obtained from sources believed to be reliable as of 4-1-2020, but its accuracy is not guaranteed. There is no representation or warranty as to the current accuracy, reliability or completeness of, nor liability for, decisions based on such information and it should not be relied on as such.
The information provided does not constitute investment advice and it should not be relied on as such. It should not be considered a solicitation to buy or an offer to sell a security or invest in a particular sector. It does not take into account any investor's particular investment objectives, strategies, tax status or investment horizon.
Investing involves risk including the risk of loss of principal. Because of their narrow focus, sector investing tends to be more volatile than investing across many sectors and companies, which would otherwise result in greater diversification of assets.
Past performance is not a guarantee of future results
Private investments are appropriate only for those investors who can tolerate a high degree of risk and do not require a liquid investment.
[1] S&P 500 closed at 3,386.15 on 2-19-20
[2] Includes amendments to From D filings. EDGAR database accessible here: https://www.sec.gov/edgar.shtml
[3] Average extraction cost is $50 per barrel (https://www.dallasfed.org/research/economics/2019/0521) and 63% of US oil production comes from shale (https://www.eia.gov/tools/faqs/faq.php?id=847&t=6)